Many businesses spend a significant amount of time and money generating data to measure their performance and inform strategy. The problem is that people who don’t work with data daily can find it difficult to understand or, worse, boring and irrelevant like the math they hated at school. But when the value of data isn’t communicated well and acted on, that data is wasted. Data storytelling is required.
Let’s briefly step back to Austria in 1847, when doctor Ignaz Semmelweis noted that 13-18 percent of maternity patients at Vienna’s hospital were dying in one ward but only 1-2 percent in a different ward. Why? After a prolonged investigation, Semmelweis discovered that the matrons in one ward were washing their hands regularly, while the doctors in the other were performing autopsies in the morning and births in the afternoon – without washing their hands in between.
Problem solved! Except it wasn’t. Semmelweis got fired and later had a mental breakdown, dying in an asylum. The doctors didn’t want to believe him. How could the matrons know more than they did? The problem was that Semmelweis hadn’t communicated his research and findings in a formal or persuasive manner. He trusted in word-of-mouth to encourage hand-washing.
Stories, not numbers
People remember stories but they don’t often remember numbers, which are singular things with abstract contexts. One Stamford University study asked students to give a series of one-minute presentations containing various statistics. Fewer than ten minutes later, the audience was asked to write all of the data they remembered from the presentations.
Only five per cent of the audience could remember a single number, but 63 per cent remembered any story that had been told. Let’s do a quick test: Without looking, can you remember the percentage of babies dying in that Viennese hospital? Now, can you remember what happened to Dr. Semmelweis?
Stories work because they use narrative. Narrative is basic interconnectivity. One thing leads to another and another in a logical and intuitive flow. It all makes sense in part and as a whole. People don’t need to remember the numbers; they need to remember what the numbers are telling them to do.
Data storytelling: The benefits
The Semmelweis example is clear: effectively communicating data and its associated actions is important – sometimes literally a lifesaver. Other benefits include:
Faster action – When everybody is aware of what the data says, why it is relevant and what the next steps are, people can act. They have the facts and understand their roles in the necessary changes.
Better meetings – We’ve all had the experience of being in a meeting that goes around in circles and digressions until there’s no time left to usefully conclude. Great data storytelling steers the focus: These are the facts, this is what they mean to the business and here is what we must do.
Better collaboration: When everyone in an organization has a clear understanding of the data, it becomes easier for different teams or departments to agree on how they can make a difference. They may think and work differently, but they all agree on the data and objectives.
That’s why we should use data storytelling. Let’s look at how.
#1: Audience
OK, so you have some data and you need to communicate it. The first step is understanding and empathizing with your audience. Who are they? Why are you addressing them? What do they want to know and what do they need to know (which could be very different things)? How experienced is your audience at interpreting data? Is it something they do every day, or are they focused on other areas?
#2: Objective
What does the data say? What are the conclusions? Most importantly: How should your audience respond to the data? It’s not enough to show that X is high and Y is low. The key point is what the business needs to do next based on that data.
The key point here is that your data storytelling needs to begin with the conclusion you’re going to give. You need to start at the end and plan the steps to get there. This is the narrative – the story – that your audience will remember.
#3: Visualization
Knowing your audience and your objectives, you next need to decide how you are going to show the data in your story. A massive spreadsheet with thousands of numbers and columns, or a line graph with lots of peaks and troughs like a heart-attack ECG will immediately turn off most audiences.
Your data visualization should be clear, though still require some level of explanation. It should contain all of the data you need to make your point, but not necessarily all of the data that exists. Remember: The storytelling part of data storytelling is the most critical.
Data storytelling #4: Building the narrative
Now you have the beginning (the data) and the end (the conclusions/actions). The story is the bit that connects those two. Context is the best beginning. Why was this data sourced? What is its importance at a micro and macro level? For example, is it connected to a specific key performance indicator (KPI)?
The below data describes one element of a social media campaign: the reach. This may be just one KPI along with engagement, shares, impressions, likes and wider KPIs connected to sales or leads. The audience needs to know what they are looking at and why it is important.
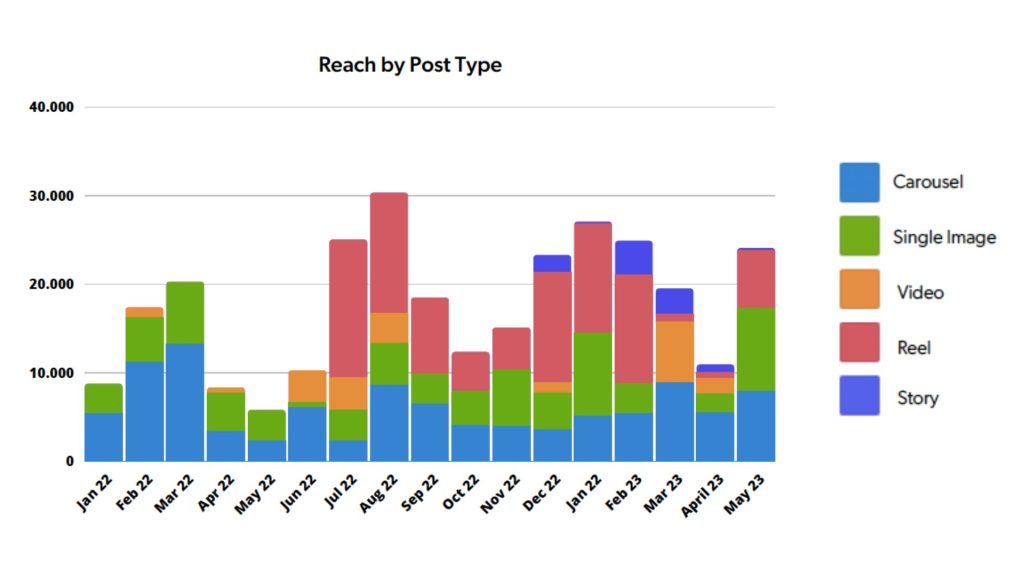
Each piece of visualized data you show the audience must be contextualized and have a natural flow. They represent chapters in your story. So you might show a series of images looking at engagement, shares and impressions before pulling all of the information together for a wider perspective on social media success.
Remember that the numbers are less important than the conclusions you draw from the data and the stories within it. The question should always be: What does this data tell us and what will we do about it? Each piece of data may have its own message (“Engagement is good”) and its own conclusion (“. . . but it was better in August. Why?”
Data storytelling #4: Clear actions
It’s not enough to look at the data and conclude, “We need to do something about social.” Each audience member or reader must understand their specific role in carrying out the actions suggested by the data. Each person or team should have a clear and measurable task to help achieve the overall objectives.
Later, when new measures have been implemented, fresh data will reveal if anything has changed and the process can begin again. It is a cycle of continuous improvement based on the stories that data tells us.
Data storytelling tips
1. Don’t get too fixated on the numbers and visualization. Pull out some specific examples to show what’s happening beneath the data. For example, you might look at the most engaging social media post that month and discuss why it was so engaging.
2. Repeat at each stage in the story what the purpose of the data is and what it is telling us. A story must be connected, which means looking back at what was said and forward to where the story is going. This helps keep people focused.
3. A classic data storytelling mistake in physical or video presentations is to ask your audience to look at the data visualization and immediately start talking about it while people are still looking. This splits their attention between the visuals and your voice. Allow people a few moments to look at the data and form their own opinions before you continue. This is more engaging.
4. If you’ve ever watched someone telling stories to children, you’ll know it’s not all one-sided. The storyteller may ask the audience, “What do you think the wolf did next?” Interactivity makes the audience part of the story. Their thoughts and opinions matter. Don’t be afraid to ask them: “What do you see here? What’s the pattern?” If there’s one thing people remember more than stories, it’s their own thoughts on a subject (especially if reinforced by the group.)
Data storytelling is not difficult, but it does require a few subtle techniques to make it work. If you’d like guidance on how to make your data work harder for you, Bucksense would be delighted to talk. Also see another article on storytelling here.


